

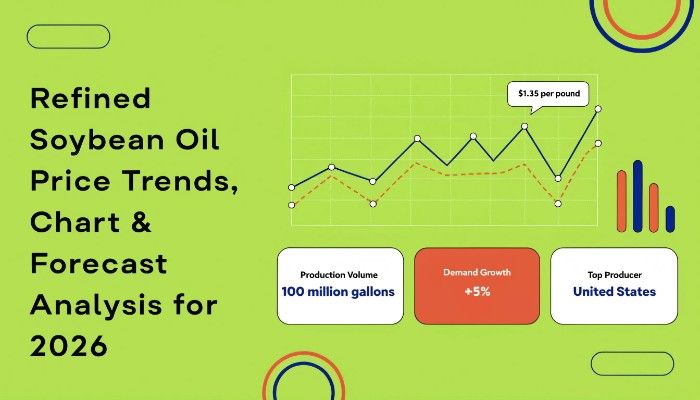
The Refined Soybean Oil Price History Chart for Q1 2026 indicates a steady upward trend supported by consistent demand and rising input costs. The Refined Soybean Oil Price Chart reflects a 4–6% increase compared to Q4 2025, showing gradual recovery across major producing regions. In the USA, prices reached USD 1,386/MT, while China recorded USD 1,177/MT. European markets such as France saw higher levels at USD 1,835/MT, while Brazil and Thailand led with USD 2,272/MT and USD 2,206/MT respectively.
This pricing pattern highlights the influence of feedstock costs and strong consumption in food and biodiesel sectors. The Refined Soybean Oil Price Index confirms stable growth with limited volatility during the quarter.
Refined Soybean Oil Price Chart Analysis Q1 2026
An in-depth analysis of the Refined Soybean Oil Price Chart shows a gradual upward movement throughout the quarter. January began with relatively moderate pricing due to slower post-harvest demand and inventory adjustments. By February, demand improved across food processing and biofuel industries, leading to steady price increases.
March recorded the highest price levels, particularly in Latin America and Southeast Asia. The lowest price point was observed in early January, mainly in Asia-Pacific markets. Compared to Q4 2025, where prices remained largely stable, Q1 2026 displayed a clearer upward trajectory.
This consistent rise reflects balanced supply conditions and growing demand, resulting in predictable pricing trends.
Refined Soybean Oil Price Trend Q1 2026: Global Insights
The Refined Soybean Oil price trend during Q1 2026 remained positive due to several interconnected factors. Corn feedstock prices influenced overall agricultural input costs, indirectly impacting soybean oil production.
Crude oil price fluctuations played a key role, especially through their effect on biodiesel demand. As biodiesel consumption increased, soybean oil demand strengthened, supporting higher prices. Additionally, improved supply chain efficiency reduced delays and stabilized distribution.
Demand from food processing, retail consumption, and renewable energy sectors contributed to steady price growth across regions.
Regional Price Analysis
North America
North America maintained moderate pricing levels, with the USA reflecting stable demand from food and biodiesel industries. Consistent production and consumption supported gradual price increases.
Europe
Europe recorded higher prices, with France leading due to strong demand and higher processing costs. The region showed steady consumption across food and industrial applications.
Asia-Pacific
Asia-Pacific displayed competitive pricing, with China maintaining lower levels due to cost-efficient production. Thailand experienced higher prices driven by strong regional demand and export activity.
Regional Price Snapshot (Q1 2026)
This pricing snapshot highlights clear regional differences influenced by production capacity, feedstock availability, and demand intensity. Latin America and Southeast Asia recorded the highest prices due to strong export demand and higher logistics costs. Europe maintained balanced levels, while Asia-Pacific offered relatively competitive pricing. Overall, the global pricing environment remained stable with gradual growth across major regions.
Key Market Drivers
Refined Soybean Oil Price Forecast 2026
The Refined Soybean Oil price forecast 2026 suggests a stable to moderately increasing trend throughout the year. Continued demand from food industries and biodiesel production is expected to support pricing.
While fluctuations in agricultural inputs and energy costs may create short-term variations, overall supply conditions are likely to remain balanced. The second half of 2026 may experience stronger growth if global demand continues to rise.
The outlook remains positive with steady and predictable price movement.
Refined Soybean Oil Price Index & Historical Comparison
The Refined Soybean Oil Price Index provides a benchmark for tracking price movements over time. Compared to previous quarters, Q1 2026 reflects a recovery phase with improved stability.
The Refined Soybean Oil Price History Chart shows gradual increases following earlier fluctuations, indicating balanced supply and consistent demand. Historical comparisons suggest that current prices are within a stable range, enabling businesses to plan procurement effectively.
This stability supports better cost management and long-term planning.
Impact on Related Industries
Refined soybean oil pricing has a direct impact on multiple industries. The food processing sector is the primary consumer, making price stability crucial for cost control. The biodiesel industry also relies heavily on soybean oil, influencing production costs and energy pricing.
Additionally, the livestock feed sector is indirectly affected through by-products. Changes in pricing can impact profitability across these industries, making stable trends beneficial.
FAQs About Refined Soybean Oil Price Trends & Market Insights:
What is the Refined Soybean Oil Price Index and why is it important?
The Refined Soybean Oil Price Index tracks price changes over time and helps businesses understand trends, manage costs, and plan procurement strategies.
How does the Refined Soybean Oil Price Chart help in analysis?
The Refined Soybean Oil Price Chart provides a visual representation of price movements, helping identify trends, peak levels, and seasonal patterns.
What is the Refined Soybean Oil price forecast 2026?
The Refined Soybean Oil price forecast 2026 indicates stable to moderately increasing prices, supported by steady demand and balanced supply conditions.
Conclusion
Q1 2026 showed a steady upward trend in refined soybean oil prices, supported by strong demand from food and biodiesel sectors. The Refined Soybean Oil Price Index reflected stable growth across major regions, with higher prices observed in Latin America and Southeast Asia.
According to IMARC Group, the outlook for 2026 remains positive, with gradual growth expected. Stable supply conditions and consistent demand are likely to keep prices predictable in the coming months.
How IMARC Pricing Database Can Help
The latest IMARC Group study, “Refined Soybean Oil Prices, Trend, Chart, Demand, Market Analysis, News, Historical and Forecast Data 2025 Edition,” presents a detailed analysis of Refined Soybean Oil price trend, offering key insights into global Refined Soybean Oil market dynamics. This report includes comprehensive price charts, which trace historical data and highlights major shifts in the market.
The analysis delves into the factors driving these trends, including raw material costs, production fluctuations, and geopolitical influences. Moreover, the report examines Refined Soybean Oil demand, illustrating how consumer behaviour and industrial needs affect overall market dynamics. By exploring the intricate relationship between supply and demand, the prices report uncovers critical factors influencing current and future prices.
About Us:
IMARC Group is a global management consulting firm that provides a comprehensive suite of services to support market entry and expansion efforts. The company offers detailed market assessments, feasibility studies, regulatory approvals and licensing support, and pricing analysis, including spot pricing and regional price trends. Its expertise spans demand-supply analysis alongside regional insights covering Asia-Pacific, Europe, North America, Latin America, and the Middle East and Africa. IMARC also specializes in competitive landscape evaluations, profiling key market players, and conducting research into market drivers, restraints, and opportunities. IMARC’s data-driven approach helps businesses navigate complex markets with precision and confidence.
Contact Us:
IMARC Group
134 N 4th St., Brooklyn, NY 11249, USA
Email: sales[@]imarcgroup.com
Tel No:(D) +91 120 433 0800
United States: +1-201971-6302
© 2025 Crivva - Hosted by Airy Hosting Managed Website Hosting.


