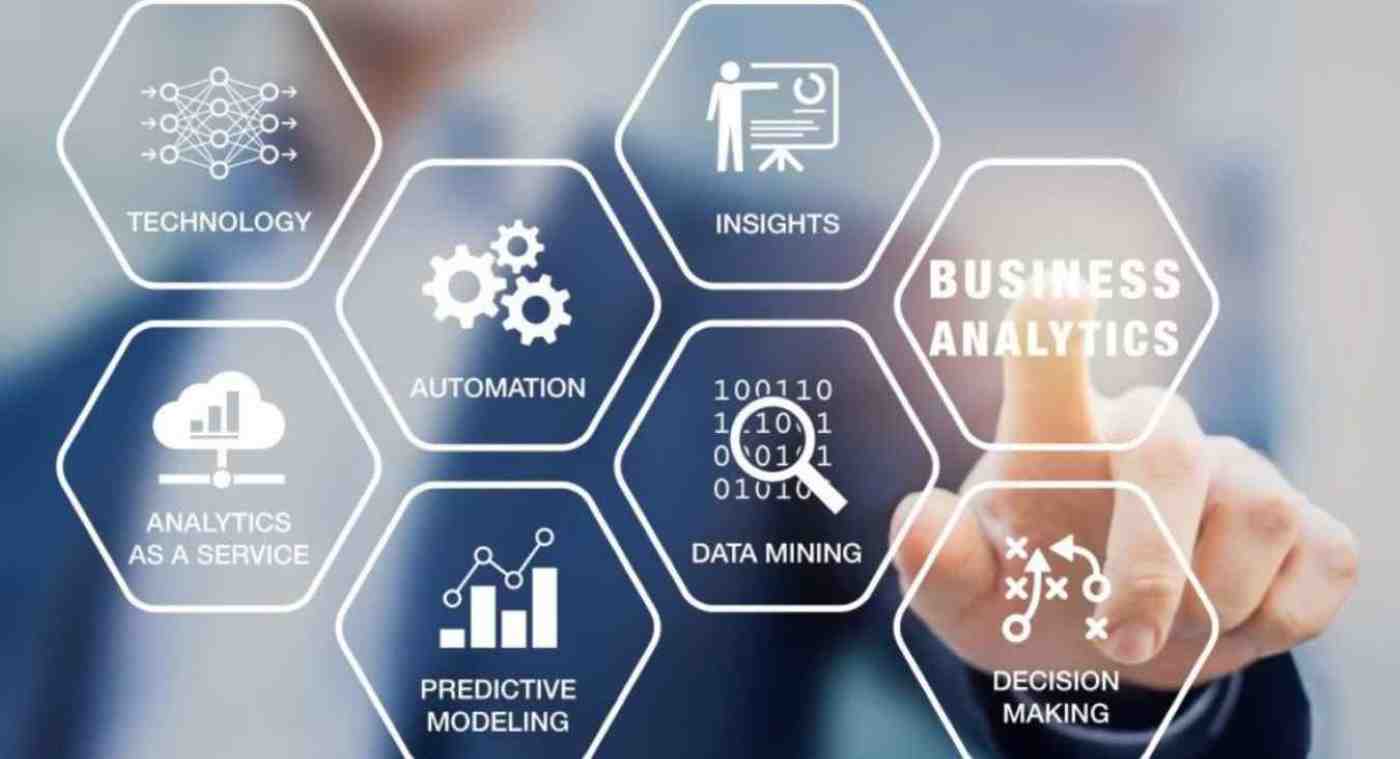
Data Analytics has now become a critical tool for companies in the fast-moving consumer goods (FMCG) sector, especially in today’s fast-paced business world. FMCG companies are under immense pressure to adjust to changing market dynamics, consumer preferences, and global competition. Data analytics can play a pivotal role in transforming these companies, enabling them to make smarter, more informed decisions. It becomes more complex in the case of data analytics within a global transformation for an FMCG company that requires planning, execution, and adaptation at its best.
The first main challenge is that most FMCG companies face the immense management of the data they have collected. An FMCG company operates across multiple countries and regions, generating massive volumes of data from various sources such as sales transactions, consumer behavior, supply chain logistics, and marketing campaigns. It is challenging to manage, store, and analyze this enormous volume of data. Also, the data is in various formats, ranging from structured data in databases to unstructured data from social media and customer feedback. One significant challenge for global companies regarding this data is that this must integrate and harmonize across different systems.
Another challenge in the data analytics implementation of an FMCG transformation is data quality. For analytics to be meaningful and meaningful in generating meaningful insight and action, the data being applied must be accurate, complete, and consistent. Maintaining high-quality data is always challenging in global operations. There may be variations in the regional sources of data, and some data may be incomplete based on several reasons, for example, varying data entry systems between regions. Data cleaning and validation procedures become necessary. However, these processes require time and resources. In the absence of good data, any information drawn from analysis can be misleading or, in the worst cases, even harmful to the company’s transformation efforts.
This adds another layer of complexity: the FMCG industry itself is not an easy business. Most of these companies deal with a broad range of products, numerous customer segments, and diverse geographical markets, each with its unique set of challenges. For instance, a marketing campaign that works in one country may not be effective in another due to cultural or economic differences. The models used in data analytics should be flexible enough to capture these differences yet yield actionable insights. More sophisticated analytical tools and skill sets are required to achieve the necessary segmentation and analysis at various levels of regions, customer groups, and product categories.
In addition, within a large global FMCG company, organizational silos can be obstacles to seamless integration of data analytics. Different departments—marketing, sales, supply chain, and finance—often work in isolation, and their data may not be shared or aligned in a way that enables holistic insights. Breaking down these silos and fostering cross-functional collaboration is essential to harness the full potential of data analytics. For data analytics to be truly impactful, insights must be shared across departments, driving decision-making and influencing strategies across the organization.
The right use of technology is another issue. Today there are multiple powerful data analytic tools which may be easily available, however the selection on the basis of needs of any global FMCG company in a complicated affair. That tool must be very scalable to digest large datasets with an adequate flexible approach so it could easily amalgamate with different existing systems as well. Companies also have to invest in cloud infrastructure, machine learning models, and artificial intelligence capabilities to process and analyze data more efficiently. However, these investments often require significant financial resources and expertise, both of which can be challenging for companies in transition.
Cultural and skill-related barriers also challenge the implementation of data analytics. The successful use of data analytics requires a mindset shift across the organization. Employees must be willing to rely on data-driven insights rather than intuition or traditional methods. Such change is possible only through strong leadership and a commitment to creating a data-centric culture. Many FMCG companies also face a shortage of data professionals with the skills required to manage and analyze data effectively. Training existing employees and hiring new talent with expertise in data science, machine learning, and business intelligence can be a costly and time-consuming endeavor.
Starting a Data Analytics Project is exciting and transformative for an organization, as businesses continue to be driven by data-backed decision-making. And to stay competitive in the market, one needs to build an efficient data analytics strategy. However, executing such a project requires careful planning, thoughtful execution, and a clear understanding of how to transform raw data into actionable insights.
The first step in starting any data analytics project is to define your business goals. Data analytics is not a one-size-fits-all approach, and it’s essential to understand how analytics can align with your specific business objectives. Are you trying to improve customer satisfaction? Do you want to streamline operations or identify new revenue opportunities? The answers to these questions will determine the scope of your project as well as the type of data you will have to collect and analyze. Thus, knowing the desired outcomes helps you avoid wasting time on pointless data collection or unnecessary analysis.
The other critical step after defining goals is data gathering and preparation. Data is the foundation of any analytics project, and without high-quality, relevant data, the project will struggle to provide meaningful results. It’s essential to identify the data sources that are most relevant to your business needs. This could involve customer data, operational data, financial data, or external sources like market trends. For instance, if the strategic objective is to enhance customer satisfaction, data must be collected from where these customers touch the organization points-including customer feedback, social media, and sales performance.
Having identified your sources of data, the next problem to face is data cleaning and preparation. Raw data is usually messy, incomplete, and inconsistent. Therefore, it may be processed for accuracy, relevance, and adequacy in preparation for analysis. Data cleaning involves removing duplicates, handling missing values, and correcting errors. This step is important because the accuracy or inconsistency of the data may be the reason for faulty conclusions and decisions. Preparing the data might also include transforming data into a form that can be used for analysis, combining data from different sources, and structuring data in a manner that simplifies its analysis.
Now, we come to the second stage: data analysis. It is here that the magic really happens because it transforms data into value-added insights. Generally, there are a number of possible methods of analysis, from the very simple statistical techniques to more sophisticated machine learning algorithms. The choice of analytical methods depends on the goals of the project and the type of data. For example, if your goal is to understand customer behavior, you might apply clustering techniques to identify customer segments or regression analysis to predict purchasing patterns.
Visualization is the key to the fruitful dissemination of your analysis results. The most sophisticated insights can be unclear and unintuitive without clear, intuitive visuals. Using tools such as Tableau, Power BI, or even Excel, your findings can be brought to everyone’s eyes-a key aspect because some of the stakeholders do not necessarily have the technical expertise. A visual representation of your findings would make it possible to point out trends, patterns, and outliers quite easily for a decision-maker’s examination and decision-making processes. The findings from data analysis can be used in making strategic decisions, improving processes, or in exploration of new opportunity spaces for growth.
Part of any data analytics project is the ongoing monitoring and refinement. Data analytics is not a once and done but rather an iterative process. As new data becomes available, the analysis should be revisited to ensure that your conclusions remain current and relevant. It is equally crucial to measure the outcome of any decision taken on the basis of analytics. This enables you to know whether the project is meeting its original goals and provides valuable feedback for the improvement of future analytics efforts.
A data analytics project would only be as good as the people behind it; this means the team should have a mix of experience from data scientists to business analysts to IT professionals. Interdisciplinary collaboration within departments is very crucial in ensuring that the insights generated can actually be acted upon and are aligned with broader company goals.
In today’s digital age, data integration stands as a cornerstone of effective data management, crucial for businesses aiming to harness the power of their data assets. Within this dynamic field, women are increasingly making their mark, contributing diverse perspectives and skills to drive innovation and efficiency. This article explores the various career paths available to women in data integration, highlighting opportunities, challenges, and strategies for success.
Understanding Data Integration
Data integration https://dataforest.ai/services/data-integration involves combining data from different sources into a unified view, enabling organizations to derive meaningful insights and make informed decisions. This process is essential for maintaining data consistency, accuracy, and accessibility across various systems and platforms.
Career Opportunities in Data Integration
- Data Integration Engineer: Responsible for designing, developing, and implementing data integration solutions. This role demands strong technical skills in databases, ETL (Extract, Transform, Load) tools, and scripting languages.
- Data Architect: Designs data integration frameworks and architectures that support the organization’s data strategy. This role requires a deep understanding of data modeling, integration patterns, and enterprise data management principles.
- Integration Specialist: Focuses on configuring and optimizing integration platforms, ensuring seamless data flow and interoperability between systems. This role often involves troubleshooting complex integration issues and implementing best practices.
- Business Intelligence Developer: Utilizes data integration to create dashboards, reports, and visualizations that empower stakeholders with actionable insights. This role combines technical expertise with a keen understanding of business requirements and user needs.
Challenges and Opportunities for Women
Despite strides towards gender equality in tech, challenges persist for women in data integration. These include:
- Underrepresentation: Women remain underrepresented in technical roles, including data integration.
- Bias and Stereotypes: Gender biases and stereotypes can influence hiring decisions and workplace dynamics.
- Career Progression: Advancing to leadership positions can be challenging due to structural barriers and lack of mentorship opportunities.
However, there are also significant opportunities:
- Diverse Perspectives: Women bring unique perspectives and problem-solving approaches to data integration, fostering innovation and creativity.
- Support Networks: Increasingly, support networks, mentorship programs, and initiatives are emerging to empower women in tech and bridge the gender gap.
- Skill Development: Continuous learning and upskilling opportunities enable women to stay competitive and advance their careers in data integration.
Strategies for Success
- Build Technical Expertise: Stay updated with the latest tools, technologies, and best practices in data integration.
- Develop Soft Skills: Effective communication, collaboration, and leadership skills are crucial for career advancement.
- Seek Mentorship: Connect with experienced professionals who can provide guidance and support throughout your career journey.
- Advocate for Inclusion: Promote diversity and inclusion initiatives within your organization and the broader tech community.
Conclusion
In conclusion, data integration offers a promising career path for women, combining technical prowess with the opportunity to drive organizational success through data-driven insights. Despite challenges, women continue to excel in this field, contributing invaluable perspectives and advancing innovation. As the demand for skilled data integration professionals grows, companies like DATAFOREST are at the forefront, providing tools and platforms that empower women to thrive in data engineering roles.
It involves various techniques and processes to extract meaningful insights, patterns, and trends from large datasets. For beginners, diving into data analytics can seem daunting, but understanding the fundamentals can provide a strong foundation. This guide will cover the basics, tools, techniques, and steps involved in data analytics.
What is Data Analytics?
Data analytics refers to the techniques and processes used to examine data sets in order to draw conclusions about the information they contain. This can involve using specialized systems and software, as well as employing statistical and computational techniques.
Importance of Data Analytics
- Decision-Making: Helps businesses make informed decisions by providing insights based on data.
- Efficiency: Improves operational efficiency by identifying bottlenecks and areas for improvement.
- Market Trends: Identifies trends and patterns in the market, helping businesses stay competitive.
- Risk Management: Assists in identifying potential risks and creating strategies to mitigate them.
Key Components of Data Analytics
- Data Collection: Gathering data from various sources, including databases, surveys, logs, and more.
- Data Analysis: Applying statistical and computational techniques to interpret the data.
- Data Visualization: Presenting data in graphical formats such as charts, graphs, and dashboards to make the information easily understandable.
Steps in the Data Analytics Process
- Define Objectives: Start with clear goals and objectives for what you want to achieve with the data analysis.
- Data Collection: Collect relevant data from multiple sources. This can be structured data (like databases) or unstructured data (like text files).
- Data Cleaning: Clean the data to ensure accuracy.
- Data Exploration: Explore the data using summary statistics and visualization tools to understand its structure and main characteristics.
- Data Modeling: Use statistical models or machine learning algorithms to analyze the data and identify patterns or predict outcomes.
- Validation: Validate the model by testing it with new data to ensure it performs well.
- Interpretation: Interpret the results to draw meaningful insights.
- Reporting: Communicate the findings through reports, visualizations, and presentations.
Tools for Data Analytics
- Excel: Widely used for basic data analysis, visualization, and reporting.
- Python: Popular programming language with libraries like Pandas, NumPy, and Matplotlib for data manipulation and visualization.
- SQL: Used for managing and querying relational databases.
- Tableau: A powerful data visualization tool that helps create interactive and shareable dashboards.
Fundamental Techniques in Data Analytics
- Statistical Analysis: Involves using statistical methods to analyze data sets. Common techniques include mean, median, mode, standard deviation, and correlation.
- Regression Analysis: Used to understand relationships between variables and for predictive modeling.
- Classification: A machine learning technique used to categorize data into predefined classes.
- Clustering: A technique used to group similar data points together based on certain characteristics.
- Time Series Analysis: Used to analyze data points collected or recorded at specific time intervals.
Practical Applications of Data Analytics
- Marketing: Analyzing customer data to create targeted marketing campaigns and improve customer engagement.
- Finance: Identifying trends in financial markets, managing risks, and optimizing investment strategies.
- Healthcare: Analyzing patient data to improve diagnostics, treatment plans, and patient outcomes.
- Retail: Understanding customer purchasing patterns to optimize inventory and improve sales.
- Sports: Using performance data to enhance player training and game strategies.
Challenges in Data Analytics
- Data Quality: Ensuring the accuracy and completeness of data.
- Data Integration: Combining data from different sources can be complex and time-consuming.
- Privacy and Security: Ensuring data privacy and security is critical, especially with sensitive information.
- Skill Gap: A shortage of skilled data analysts and scientists can be a hurdle.
- Scalability: Analyzing large volumes of data efficiently requires robust tools and infrastructure.
Future of Data Analytics
The field of data analytics is continuously evolving with advancements in technology. Emerging trends include:
- Artificial Intelligence (AI) and Machine Learning: Enhancing predictive analytics and automating data analysis processes.
- Big Data Analytics: Leveraging big data technologies to analyze large and complex data sets.
- Real-Time Analytics: Analyzing data in real-time for immediate insights and actions.
- Data Governance: Implementing robust data governance frameworks to ensure data integrity and compliance.
- Edge Analytics: Performing data analysis at the edge of the network where the data is generated, reducing latency and bandwidth usage.
Conclusion
Data analytics is a powerful tool that can drive decision-making, enhance efficiency, and provide valuable insights across various industries. For beginners, understanding the fundamentals involves grasping the different types of analytics, key components, and basic techniques. By leveraging the right tools and following a structured process, anyone can start their journey in data analytics and unlock the potential of data-driven insights. Finding the Best Data Analytics Training in Delhi,Noida , Mumbai, Indore, and other parts of India can significantly accelerate this learning process.