Discover the essentials of hydrographic surveys with this step-by-step guide by Epitome.
In today’s rapidly evolving world, where maritime safety, coastal development, and environmental sustainability are top priorities, hydrographic surveys have emerged as the epitome of underwater precision and marine intelligence. From mapping the seafloor to supporting offshore construction, hydrographic surveying is essential for understanding aquatic environments in ways that shape industries, economies, and ecological futures.
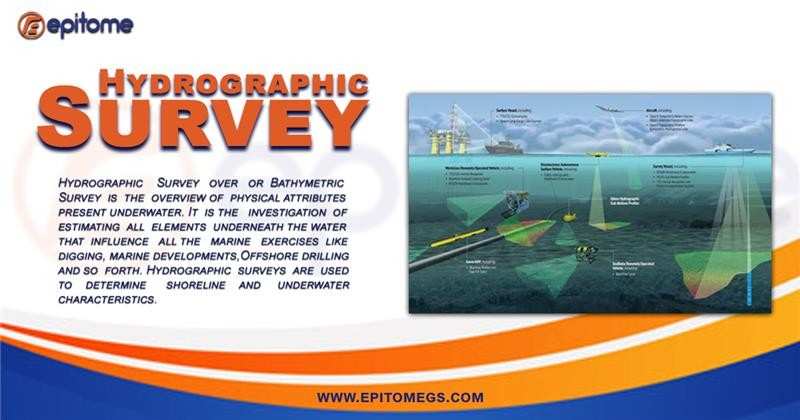
A hydrographic survey involves the measurement and description of features which affect maritime navigation, marine construction, dredging, offshore oil exploration, and related activities. It primarily focuses on collecting data about depths, tides, currents, seabed contours, and underwater obstacles using advanced technologies.
These surveys are critical for preparing accurate nautical charts, planning underwater infrastructure, and ensuring the safety of vessels and marine operations.
A hydrographic survey is the process of measuring and mapping the underwater features of oceans, rivers, lakes, and harbors. It helps ships travel safely, supports marine construction, and helps protect the environment. Let’s break down how this process works in simple steps:
1.Planning the Survey
Before going into the water, the survey team makes a clear plan. They decide:
Where the survey will happen
What equipment they’ll need
What kind of information they want (like depth, underwater objects, or tides)
2.Setting Up GPS and Tide Information
To know exactly where they are in the water, the team uses GPS (just like on your phone, but more accurate).
They also set up tide meters to track how high or low the water is, which helps make the depth data more accurate.
3.Collecting the Data
Now it’s time to go out on the boat! The team uses special tools like:
Echo sounders – These send sound waves down to the seafloor and measure how long they take to bounce back. That tells them how deep the water is.
Sonar scanners – These make images of the underwater area, like finding rocks, shipwrecks, or cables.
Other sensors – They use tools to check water temperature, current, and how sound travels in water.
4 Watching the Tides and Currents
Since water moves all the time, the team also records tides and water currents. This helps them adjust the depth numbers correctly. Otherwise, the data might be wrong depending on when they measured it.
5 Cleaning and Processing the Data
Once they’re done collecting data, it’s time to clean it up. This means:
Removing mistakes or weird signals
Making sure everything is lined up properly
Turning the raw data into useful maps or 3D images of the seafloor
6 Making the Charts and Maps
After cleaning the data, the team creates:
Maps that show how deep the water is
Charts for ship navigation
Reports with all the results for builders, engineers, or government agencies
7 Sharing and Saving the Data
Finally, all the maps, reports, and data files are shared with the people who need them—like port authorities, shipping companies, or construction teams. The information is also saved in case it’s needed in the future.
Conclusion
Hydrographic surveys may happen beneath the surface, but their impact is felt everywhere — from safer shipping routes to smarter coastal development. By using advanced tools and careful planning, these surveys give us a clear and accurate picture of the underwater world.
Whether it’s for navigation, construction, or environmental protection, hydrographic surveys are the key to understanding and managing our water bodies. In every sense, they are the epitome of precision in marine science and technology.